| Event type: | Meeting |
| Date: | 13 January 2027 |
| Time: | 2:00 PM |
| Venue: | Burton Hall, Hythe |
| Organiser: | |
| Cost: | £2.00 |
From Numbers to Networks: How Cartography Tells Our Story
After studying Cartography at University, Janice and Steve Ramsay have spent many years as cartographers. They will show how Cartography uses geography, design and maths to convert data into easily understood visual representations. There are many types of maps, showing information such as geographical features, political boundaries and economic and social trends. Nowadays, most of us are familiar with Satnav ( GPS - Global Positioning System) and Google maps, key elements of modern cartography.
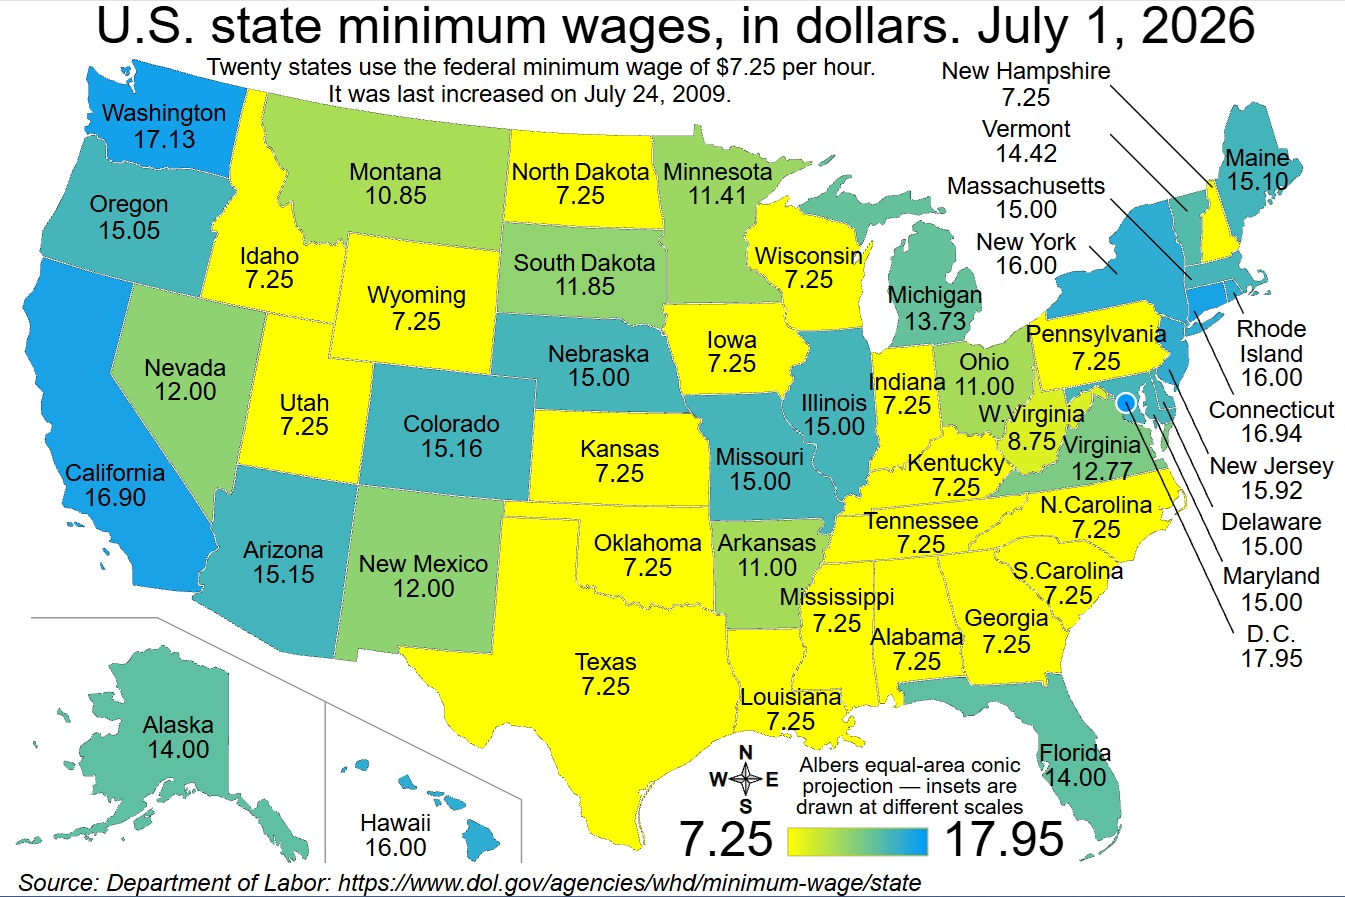
The example map below shows hourly, minimum wages for US states in July 2026.